by
by 
Technical Analysis, an essential cog in the wheel of financial trading, is a methodology used to predict future price movements based on statistical patterns found in historical price and volume data. This approach, revered for its quantitative edge, is a key strategy in cryptocurrency trading. The volatile nature of the crypto market, characterized by drastic price swings, necessitates informed trading decisions. Technical analysis acts as a compass, guiding traders through the tumultuous sea of crypto trading, and identifying potential opportunities for profitability. This approach offers a structured way to analyze market movements and make educated predictions about future trends.
Page Contents
Understanding the Basics of Technical Analysis
Technical analysis in its essence is the study of market action primarily through the use of charts, for the purpose of forecasting future price trends. Its core principles revolve around the concepts of supply and demand, market psychology, and the idea that history tends to repeat itself.
Key concepts in technical analysis like support and resistance levels, trend lines, and chart patterns form the foundational bricks of this methodology. Support and resistance levels are like invisible barriers that prevent the price of a cryptocurrency from moving in a certain direction. Trend lines, on the other hand, help traders visually see the market trend, be it upward, downward, or sideways. Lastly, chart patterns like Head and Shoulders, Double Tops and Bottoms, and Triangles are graphical representations of price movements that can signify future trends.
Choosing the Right Indicators
A myriad of technical indicators graces the arsenal of a crypto trader. Some popular ones include Moving Averages (MA), Relative Strength Index (RSI), Moving Average Convergence Divergence (MACD), and Bollinger Bands.
Moving Averages smooth out price data to form a trend-following indicator and are primarily used to identify price direction. RSI is a momentum oscillator that measures the speed and change of price movements, helping identify overbought and oversold conditions. MACD is a trend-following momentum indicator that shows the relationship between two moving averages of a security’s price. Bollinger Bands consist of a middle band (with an N-period moving average) and an upper and lower band representing standard deviation levels.
Each indicator plays a crucial role in signaling potential price movements, helping traders make informed decisions. Ford additional help contact outlets such as https://quantum-code.app/.
Candlestick Patterns
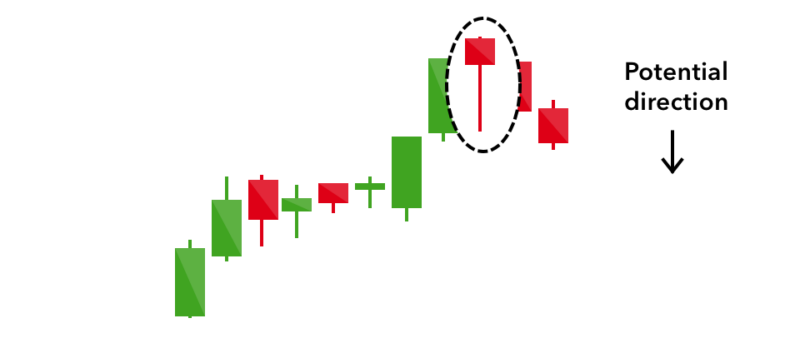
In the world of technical analysis, candlestick patterns are the linguists, communicating market sentiment in a unique visual format. The Doji, hammer, and engulfing are common patterns that speak volumes about potential trend reversals.
A doji signifies indecision in the market, hinting at a potential change in trend. The hammer, resembling a hammer with a small body and long lower wick, is often seen at the bottom of a downtrend, indicating a bullish reversal. The engulfing pattern, which comes in bullish or bearish forms, signifies that buyers or sellers have taken control and the tide may be turning.
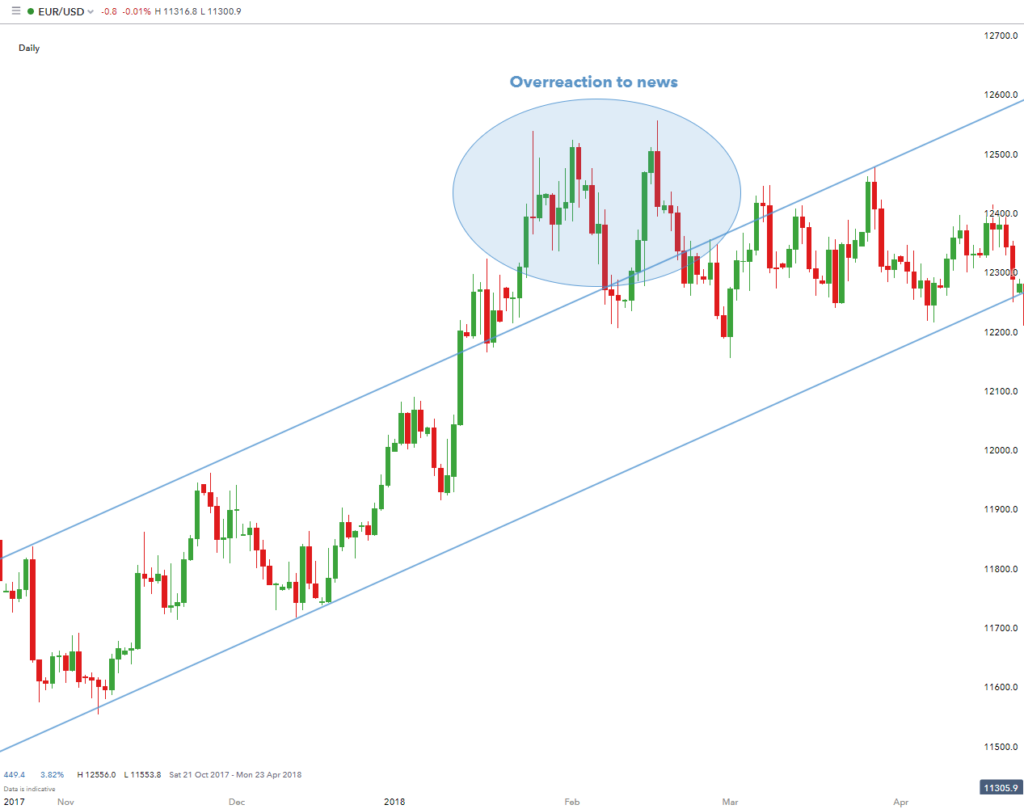
Trend Analysis
Trends play a vital role in technical analysis. An upward trend signifies a continual rise in prices, a downward trend denotes a consistent fall, and a sideways trend indicates little change in price levels. Identifying these trends helps traders understand market direction.
Tools like moving averages and trend channels aid in trend analysis. Moving averages smooth out price data, helping identify the overall trend. Trend channels consist of parallel trend lines that act as a visual representation of the trend and provide potential entry and exit signals.
Support and Resistance Levels
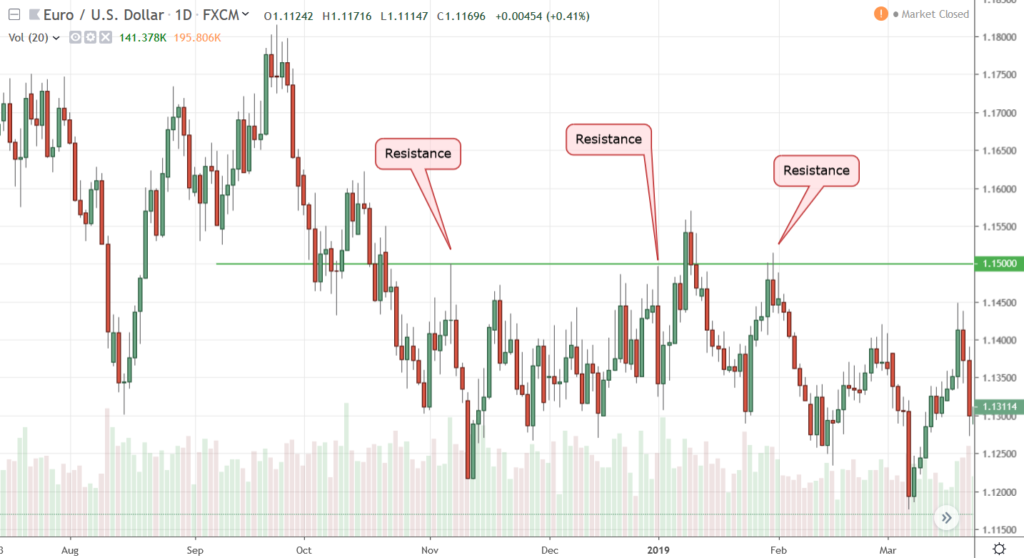
In the realm of technical analysis, the landscape where buyers and sellers engage in a relentless battle is referred to as support and resistance levels. The support level is akin to a safety net, a price point where the demand is robust enough to stave off further depreciation. Conversely, the resistance level acts as a barrier, a ceiling that curtails any additional price escalation due to intensified selling activity.
These levels are not just arbitrary numbers but significant indicators that traders scrutinize carefully. Traders rely on these levels for making strategic decisions about when to initiate or terminate trades. They understand that these levels can help predict future price trajectories, thereby playing a crucial role in formulating effective trading strategies.
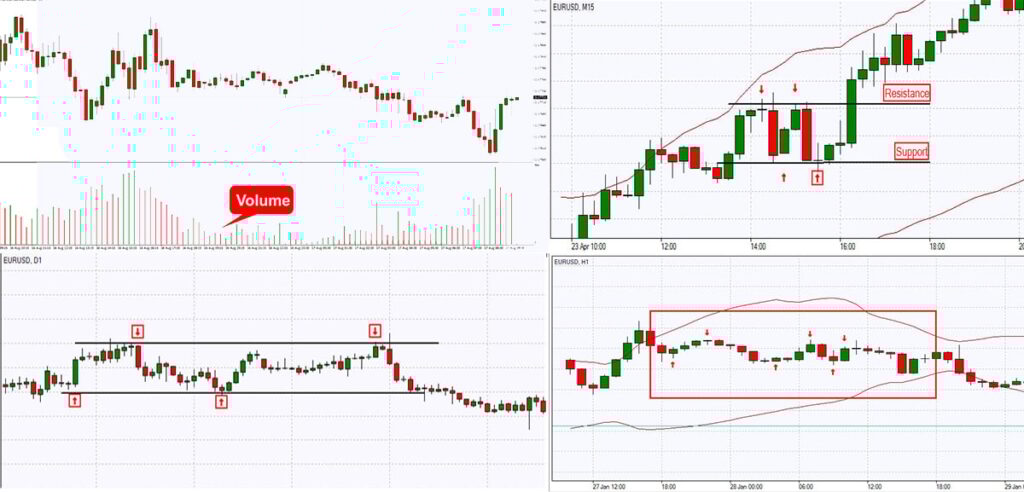
Volume Analysis
Volume analysis introduces another facet to the multifaceted world of technical analysis. It serves as a confirmation mechanism for price shifts, providing insights into the strength of market trends. If a price fluctuation is accompanied by a high volume, it gains greater significance as it signals strong market sentiment.
This analysis can help traders distinguish between misleading price changes and those signaling a potential shift in the market trend. By cross-referencing the volume data with price shifts, traders can get a clearer picture of the prevailing market sentiment. It helps identify the degree of trader interest and involvement in a particular cryptocurrency, thereby indicating whether the current market trend is gaining or losing momentum.
Fibonacci Retracement and Extensions
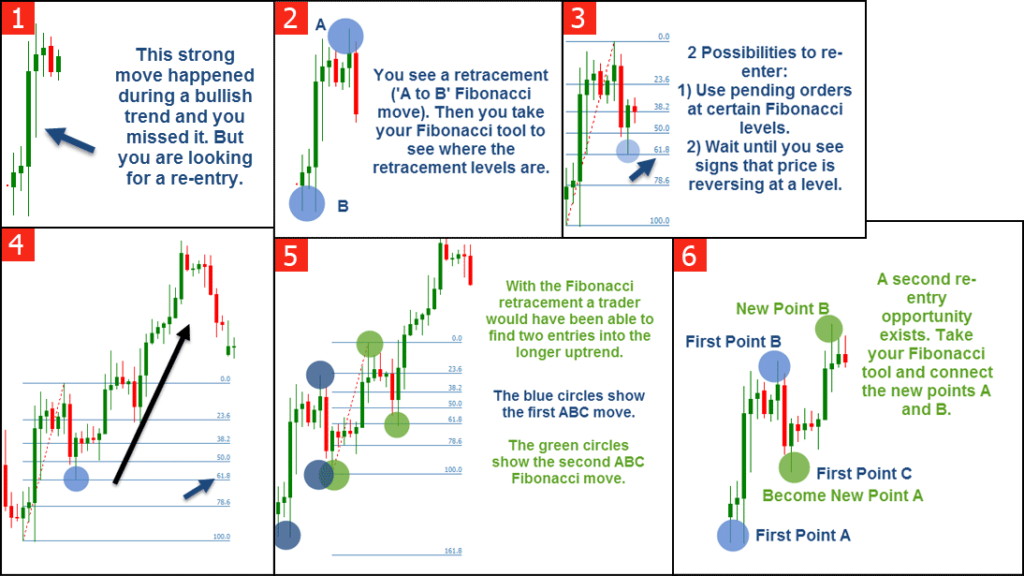
Fibonacci tools add a predictive edge to technical analysis. Traders use Fibonacci retracement to identify potential reversal levels, and Fibonacci extensions to predict potential price targets. These tools leverage the “golden ratio” found throughout nature and the financial markets to provide insights into market trends and turning points.
Risk Management in Technical Analysis
Risk management is as crucial in crypto trading as navigation tools for a sailor. One of the primary tools traders use for risk management is stop-loss orders. This allows traders to limit their loss by setting a level at which their crypto will be automatically sold if the price drops.
Backtesting and Strategy Development
Backtesting is the practice of testing a trading strategy on historical data to verify its effectiveness. This approach provides traders with confidence in their strategy and can identify potential areas for improvement. Developing a trading strategy involves choosing the right indicators, setting entry and exit rules, and managing risk effectively.
Integrating Fundamental Analysis with Technical Analysis
For a comprehensive view of the market, traders often combine fundamental analysis with technical analysis. Fundamental analysis evaluates a cryptocurrency’s intrinsic value, while technical analysis focuses on price movements and patterns. Using both approaches can provide a more robust framework for making well-informed trading decisions.
Conclusion
Technical analysis is a powerful tool in the crypto trader’s toolbox. It helps navigate the volatile crypto market and make informed trading decisions based on historical price and volume data. Whether it’s identifying support and resistance levels, understanding candlestick patterns, or managing risk effectively, technical analysis offers valuable insights. However, like any tool, it requires practice and refinement. So, delve into the crypto market, practice your technical analysis skills, and embark on your trading journey.
Remember, the best trader is an informed trader. Happy trading!